Diagnosing, designing and measuring behavioural interventions

Chapter Thirteen

Ink stamps and clean hands, Chile

In this chapter we saw how following an end-to-end process of practically applying nudge theory in a real-world context brings together concepts and principles discussed in previous chapters.

This chapter details how to diagnose a behavioural problem with the help of theory and how to design a solution by applying behaviour changed framework as a tool. It also emphasises how important context is for diagnosing and applying behavioural solutions. The abbatoir was noisy, hand stations over crowded, workers used to being covered in blood splattering, disengaged.
 
This is the actual intervention being delivered in situ - as you can see the environment was challenging!


Diagnosing the Problem


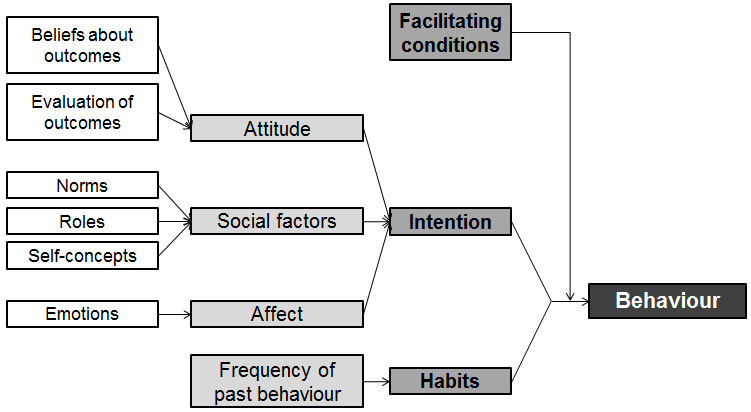
Applying principles such as diagnosing the problem with a behavioural audit and, in this case, desk research, revealed habits play a large role in hand washing behaviour and Jez applied Triandis' Theory of Interpersonal Behaviour, which explains complex behaviour as a result of social and environmental factors.

Triandis-Theory-of-Interpersonal-Behaviour-model-as-adapted-by-Jackson


Here is an interview with Gaston Godin on the subject -


Solve the problem using behavioural design. In the hand washing workshop MINDSPACE was used as the framework which is simple to use and accessible for novices.
 
In this chapter we also used the STARGAZER technique, which quickly identifies the strengths and weaknesses of your ideas.
 
Step 1 - get the team to shout out the dimensions you think are important for the ideas to succeed
 
For example - cost, resources, time, blockers, creative, fame building, efficacy etc etc
 
Step 2 - draw axes on a radar or spider chart and write these titles on the outer edges
 
Step 3 - score each dimension on a rating of 1 to 10 with 1 on the inner circle and 10 on the outer limit, with the team shouting out and you facilitating
 
Step 4 - join up all the dots to create a radar chart
 
Step 5 - stand back and assess the viability of your ideas
 
Step 6 - having seen where each idea is weak, you can bolt-on new parts to bolster them
 
Check out this resource about how to use Radar or Stargazing charts in innovation processes.


Finally, run an experiment to measure the outcome. In this case, it wasn’t hand washing, CCTV footage or employee feedback that would be the ultimate test of whether the experiment had worked. It was the reduction in bacteria. To avoid the Hawthorne effect (where study participants behave differently if they know they are being watched) it was important to establish measure the outcome in already applied processes (such as the swabs of workers hands).

To learn more about the Hawthorne effect:
 
Or watch this video to understand more:


Whilst the outcome may be successful in the short term, it's important to follow up after the intervention to determine whether the change has been sustained - in this case a 63% reduction in bacteria.

And if you're particularly interested in finding out more about hand hygiene, see here for the Global Handwashing Partnership's use of nudging.